Simple Statistics
Goals
Learn to do linear regressions and t-tests with simulated data.
Skills
Simulate noisy data with Numpy’s random number generators
Fit data with Scipy’s linregress function
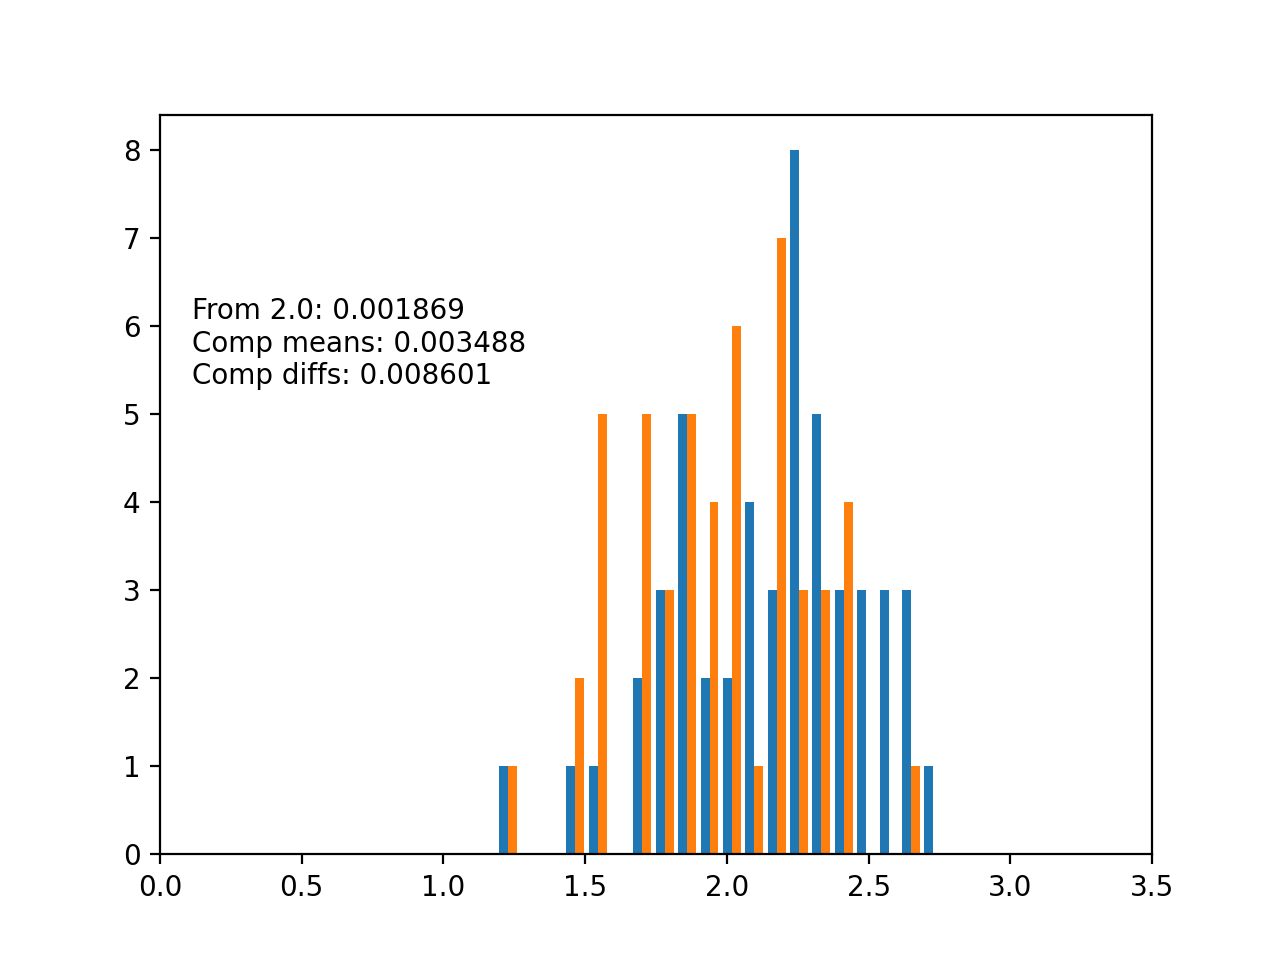
Do simple t-tests with Scipy’s ttest_1samp, ttest_ind, and ttest_rel
Make a plot with Matplotlib’s hist function
Creating a custom text string using string formatting
Final Product
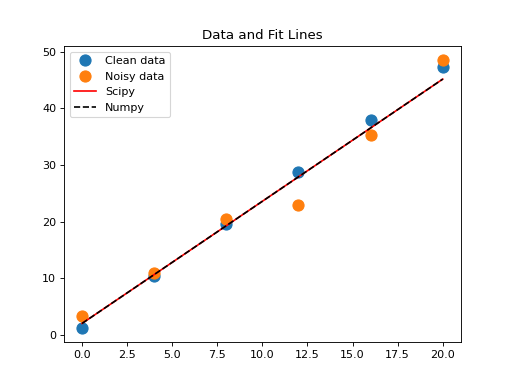
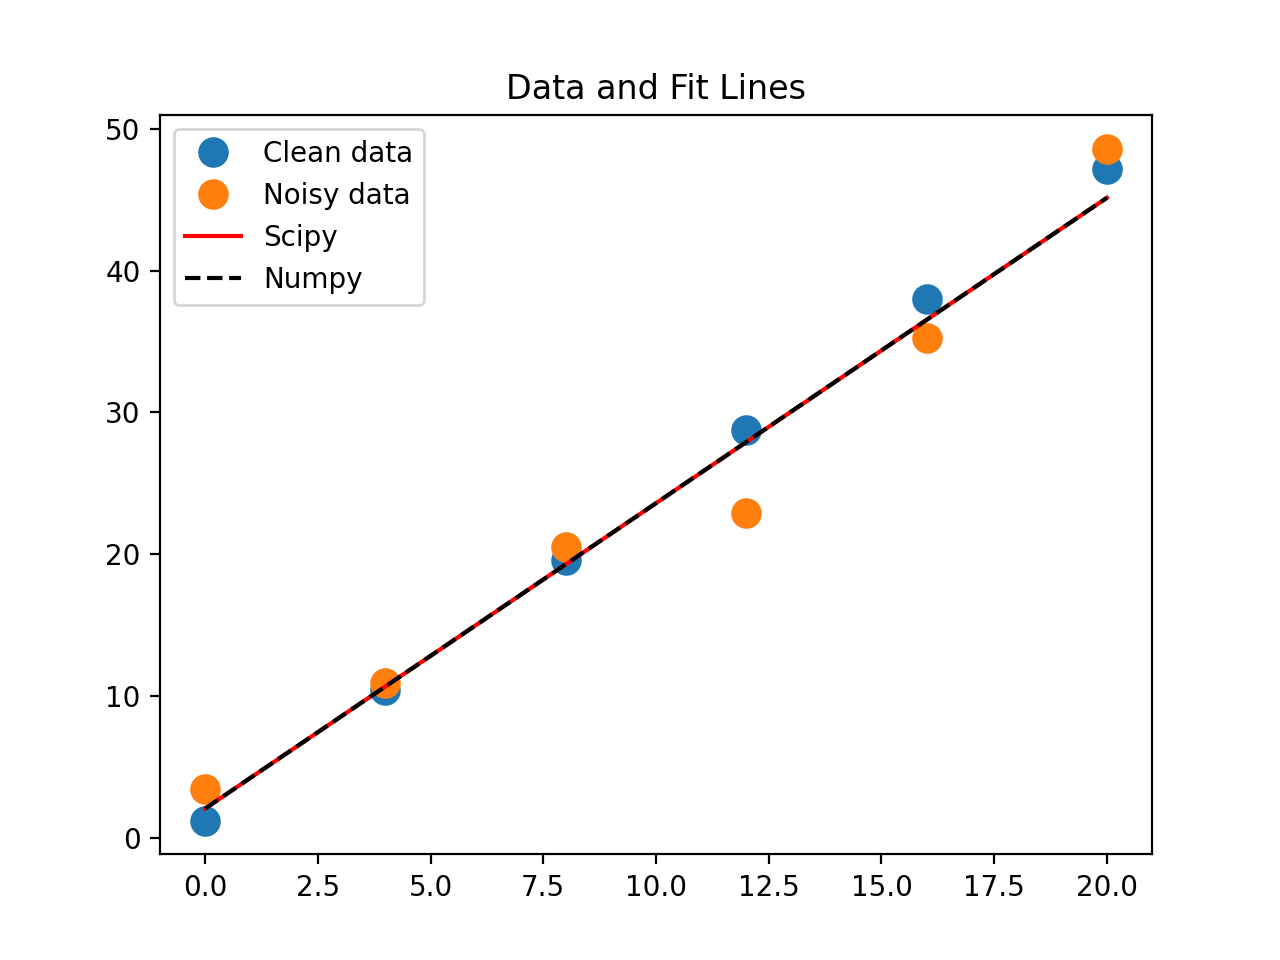
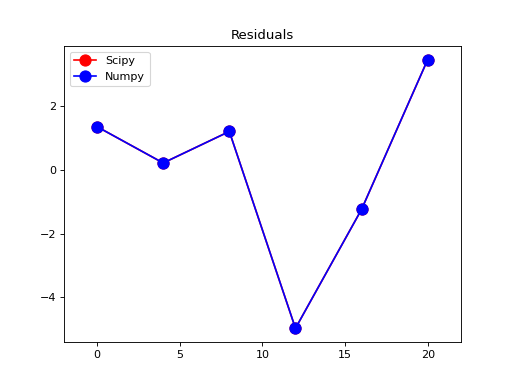
Linear regression with residuals (2 plots):
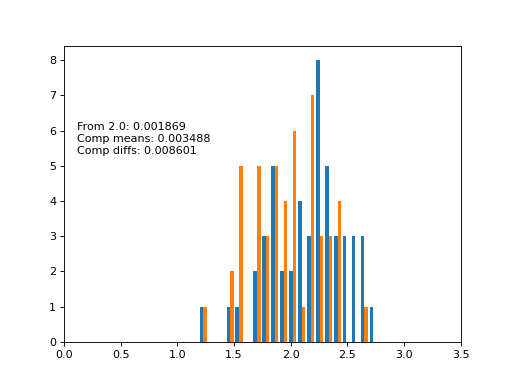
Simple t-tests and a histogram:
(Source code, png, hires.png, pdf)